Mathyus Marshall-Panayiotou
12/11/2019
31086438
University of Southampton, Foundation Year Engineering
” “I am aware of the requirements of good academic practice and the potential penalties for any breaches”.
Background Information
Hooke’s law concerns the elasticity of materials, in particular when a material is compressed or stretched.
This law was discovered by Robert Hooke, An “English physicist who discovered the law of elasticity, known as Hooke’s law, and who did research in a remarkable variety of fields”. (Encyclopedia Britannica, 2019)
The formula for Hooke’s law is given as;
F = -kx
Where:
k= F/x and is constant (N/m).
x = deformation (meters).
F = applied force (Newtons)
Therefore, Force applied to an elastic material is directly proportional to the resulting deformation according to Hooke’s law.
From the formula above it can be seen that if a graph of deformation against applied force is plotted, a straight line will be formed (y= mx + c), with a gradient of k.

Typical graph of Extension against load in a wire (2016)
Hooke’s law is only valid for materials up until a certain force is applied, then the material enters plastic deformation.
Plastic deformation means that a material will not recover from the resultant extension/compression from a force that brings it over the elastic limit. Deformation plotted against applied force will no longer be linear (as seen in the graph above).
Experiment results and analysis
I will begin with two materials kept within their elastic limit. Below is a graph comparing force on the x axis against extension in the y axis for these two materials.


A linear trendline has been drawn (see the dotted lines) and it fits the results of my experiment sufficiently.
The k value for my materials is simply the gradient of the straight lines;
k1 = 1.5583 for ‘Elastic Material 1’
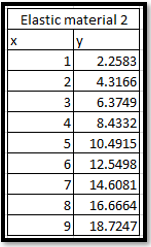
k2 = 2.0583 for ‘Elastic Material 2’
All this means is that for every newton of force applied within the elastic limit, my material will expand (or compress) by the value of k in millimetres (for this experiment).
If I would like to determine the point where both materials have the same value of deformation, I can equate the lines simultaneously.
This can be done in excel using the goal seek function.

The difference between y-values needs to equal zero, so I will use the goal seek function to set a cell ‘y1-y2’ to value zero by changing a cell containing an arbitrary x-value
When the cells are placed into the correct boxes, I yield the following result.

So my intercept occurs at the co-ordinate (2.35, 5.037)
This value is when both materials will have the same deformation due to the same applied force.
Below is a worked example to ensure my results are correct.
The two equations for elastic materials 1 and 2 (from the first graph) are given below.
(1) y=1.5583x + 1.375
(2)y=2.0583x + 0.2
The y values must be equal so:
y = 1.5583x + 1.375 = 2.0583x + 0.2
seperating variables and solving for x gives:
(2.0583 – 1.5583)x = (1.375 – 0.2)
x = (1.375 – 0.2) / (2.0583 – 1.5583)
x = 2.35
Substituting x into either equation (i will use (1)) yields:
y = 1.5583(2.35) + 1.375
y = 5.037
Which is the same result I achieved using the goal-seek function in excel.
Next, I will observe the deformation of a material that has gone past its elastic limit.
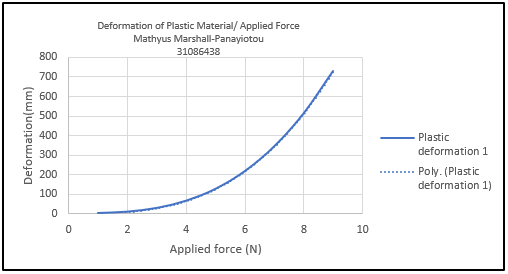
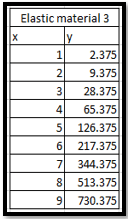
Deformation begins to increase exponentially at this point and will no longer return to its original shape once the load has been removed. The behaviour of a material past the elastic limit becomes unpredictable and the material will either break or stop expanding/compressing altogether at a certain point.
Conclusion
Hooke’s law is very accurate when predicting the behaviour of materials before they have passed a certain limit known as the elastic limit. This is demonstrated in my graphical and tabulated data for two different materials showing the same linear relationship between force and deformation.
In my experimental data for plastic deformation, Hooke’s law begins to break down as the relationship between force and deformation becomes exponential and less predictable than elastic deformation.
Possible Errors
For ‘Elastic material 1’ there is a point in the x co-ordinates between 6 and 8 newtons of force where the deformation does not fit into the trendline produced in the graph. This could be due to many different reasons such as human error or previous damage to the material.
This error is an exception and all other data fits very well into the trend-line. The data is accurate enough to show a very clear linear relationship between applied force and deformation.
Bibliography
Encyclopedia Britannica. (2019). Robert Hooke | Biography, Discoveries, & Facts. [online] Available at: https://www.britannica.com/biography/Robert-Hooke [Accessed 11 Nov. 2019].
Student.unsw.edu.au. (2019). Citing Images and Tables Found Online | UNSW Current Students. [online] Available at: https://student.unsw.edu.au/citing-images-and-tables-found-online [Accessed 11 Nov. 2019].
